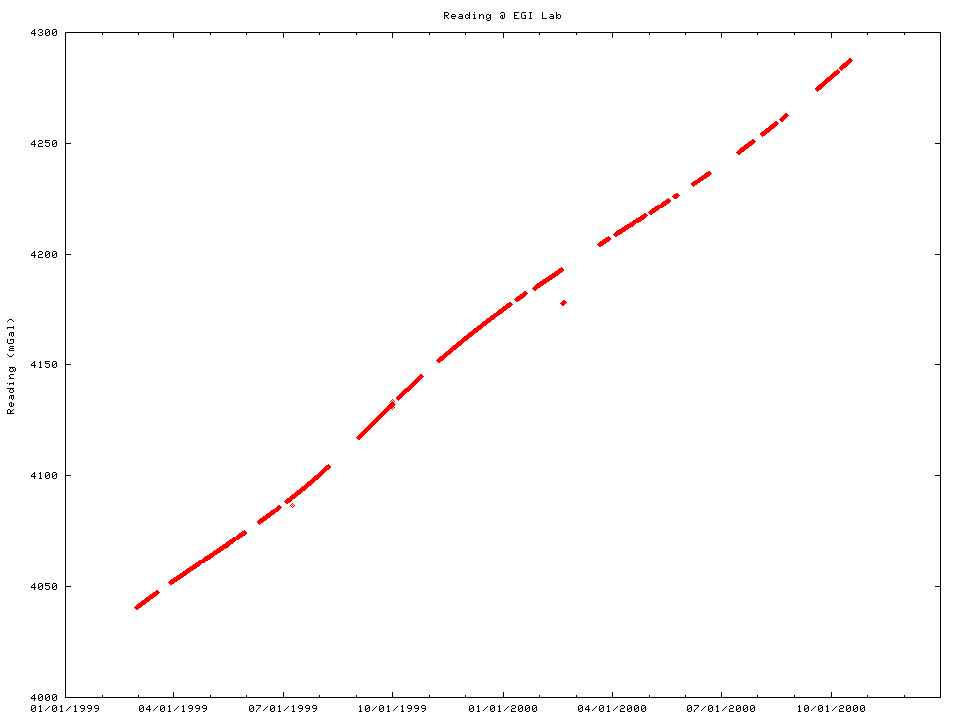
Fitting a line to the signal results in a slope of 0.417398 mGal/day. Subtracting the linear trend produces the plot below.
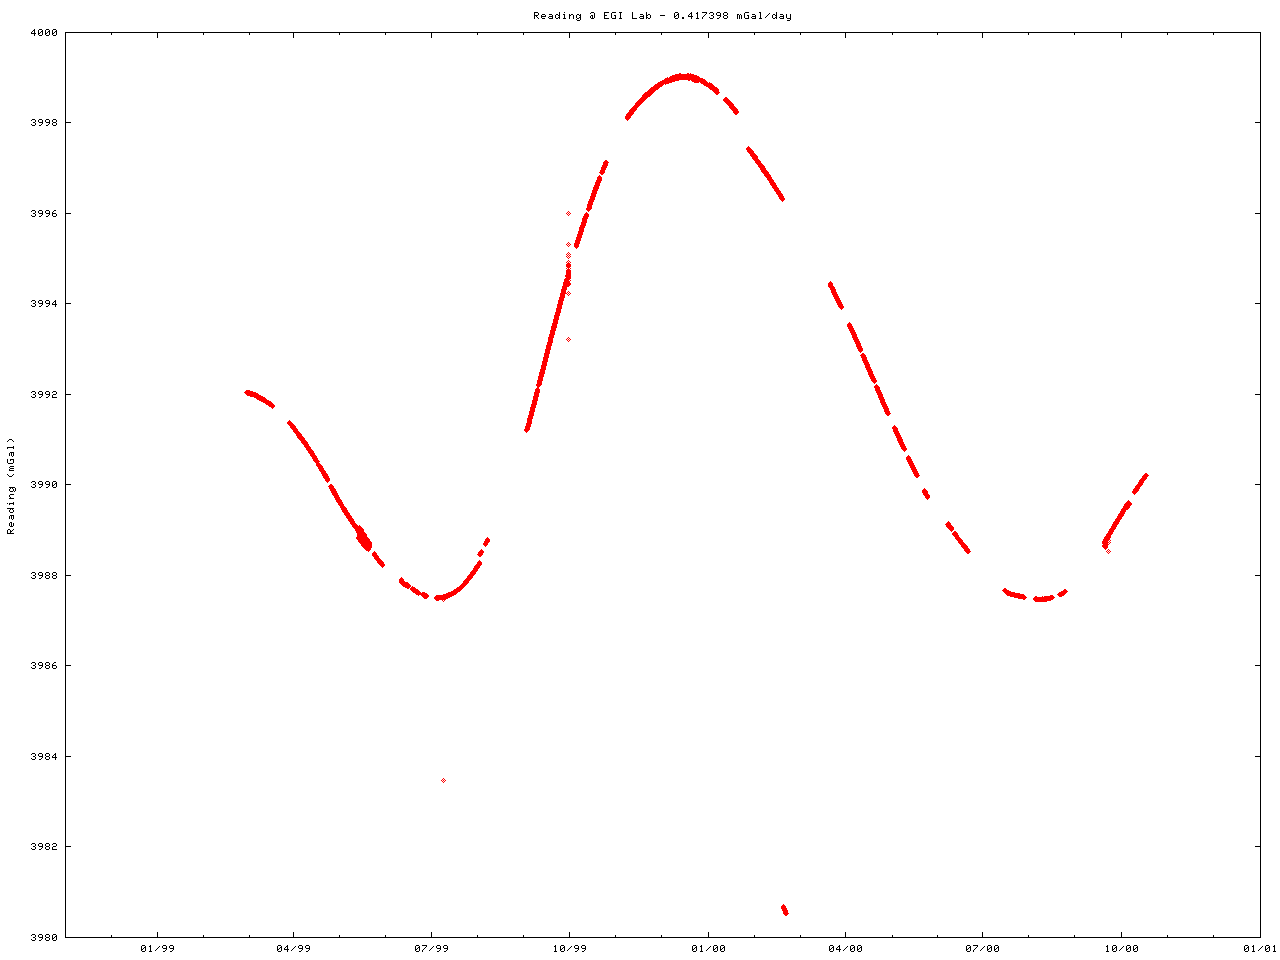
Where does this 10 mGal signal come from? Purely internal to the meter, with pure chance making it look like a seasonal groundwater signal? Is the signal from some sort of climate effect in the storage building?
I am confused.