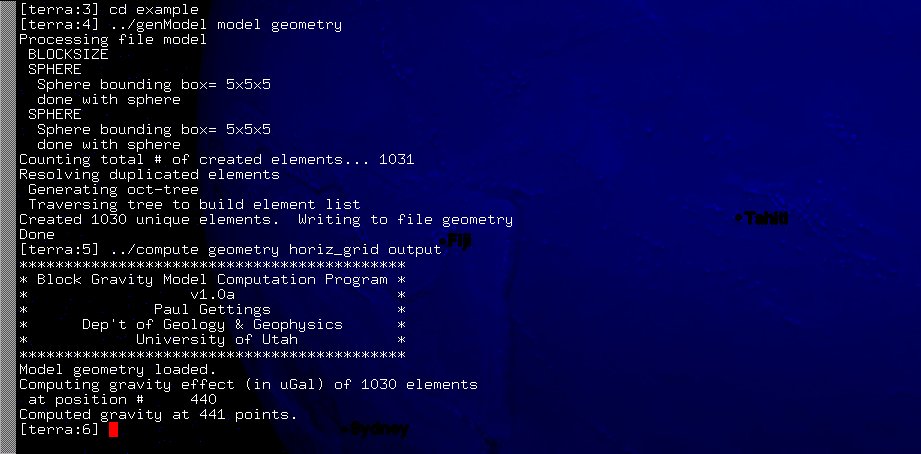
The preceeding image is a capture of an xterm (actually, an aterm) running the model geometry generator, and then the gravity computation. This is using the example geometry in the example/ directory of the package.
Computation Interface
The preceeding image is a capture of an xterm (actually, an aterm)
running the model geometry generator, and then the gravity computation.
This is using the example geometry in the example/ directory of the
package.
2 Buried Spheres
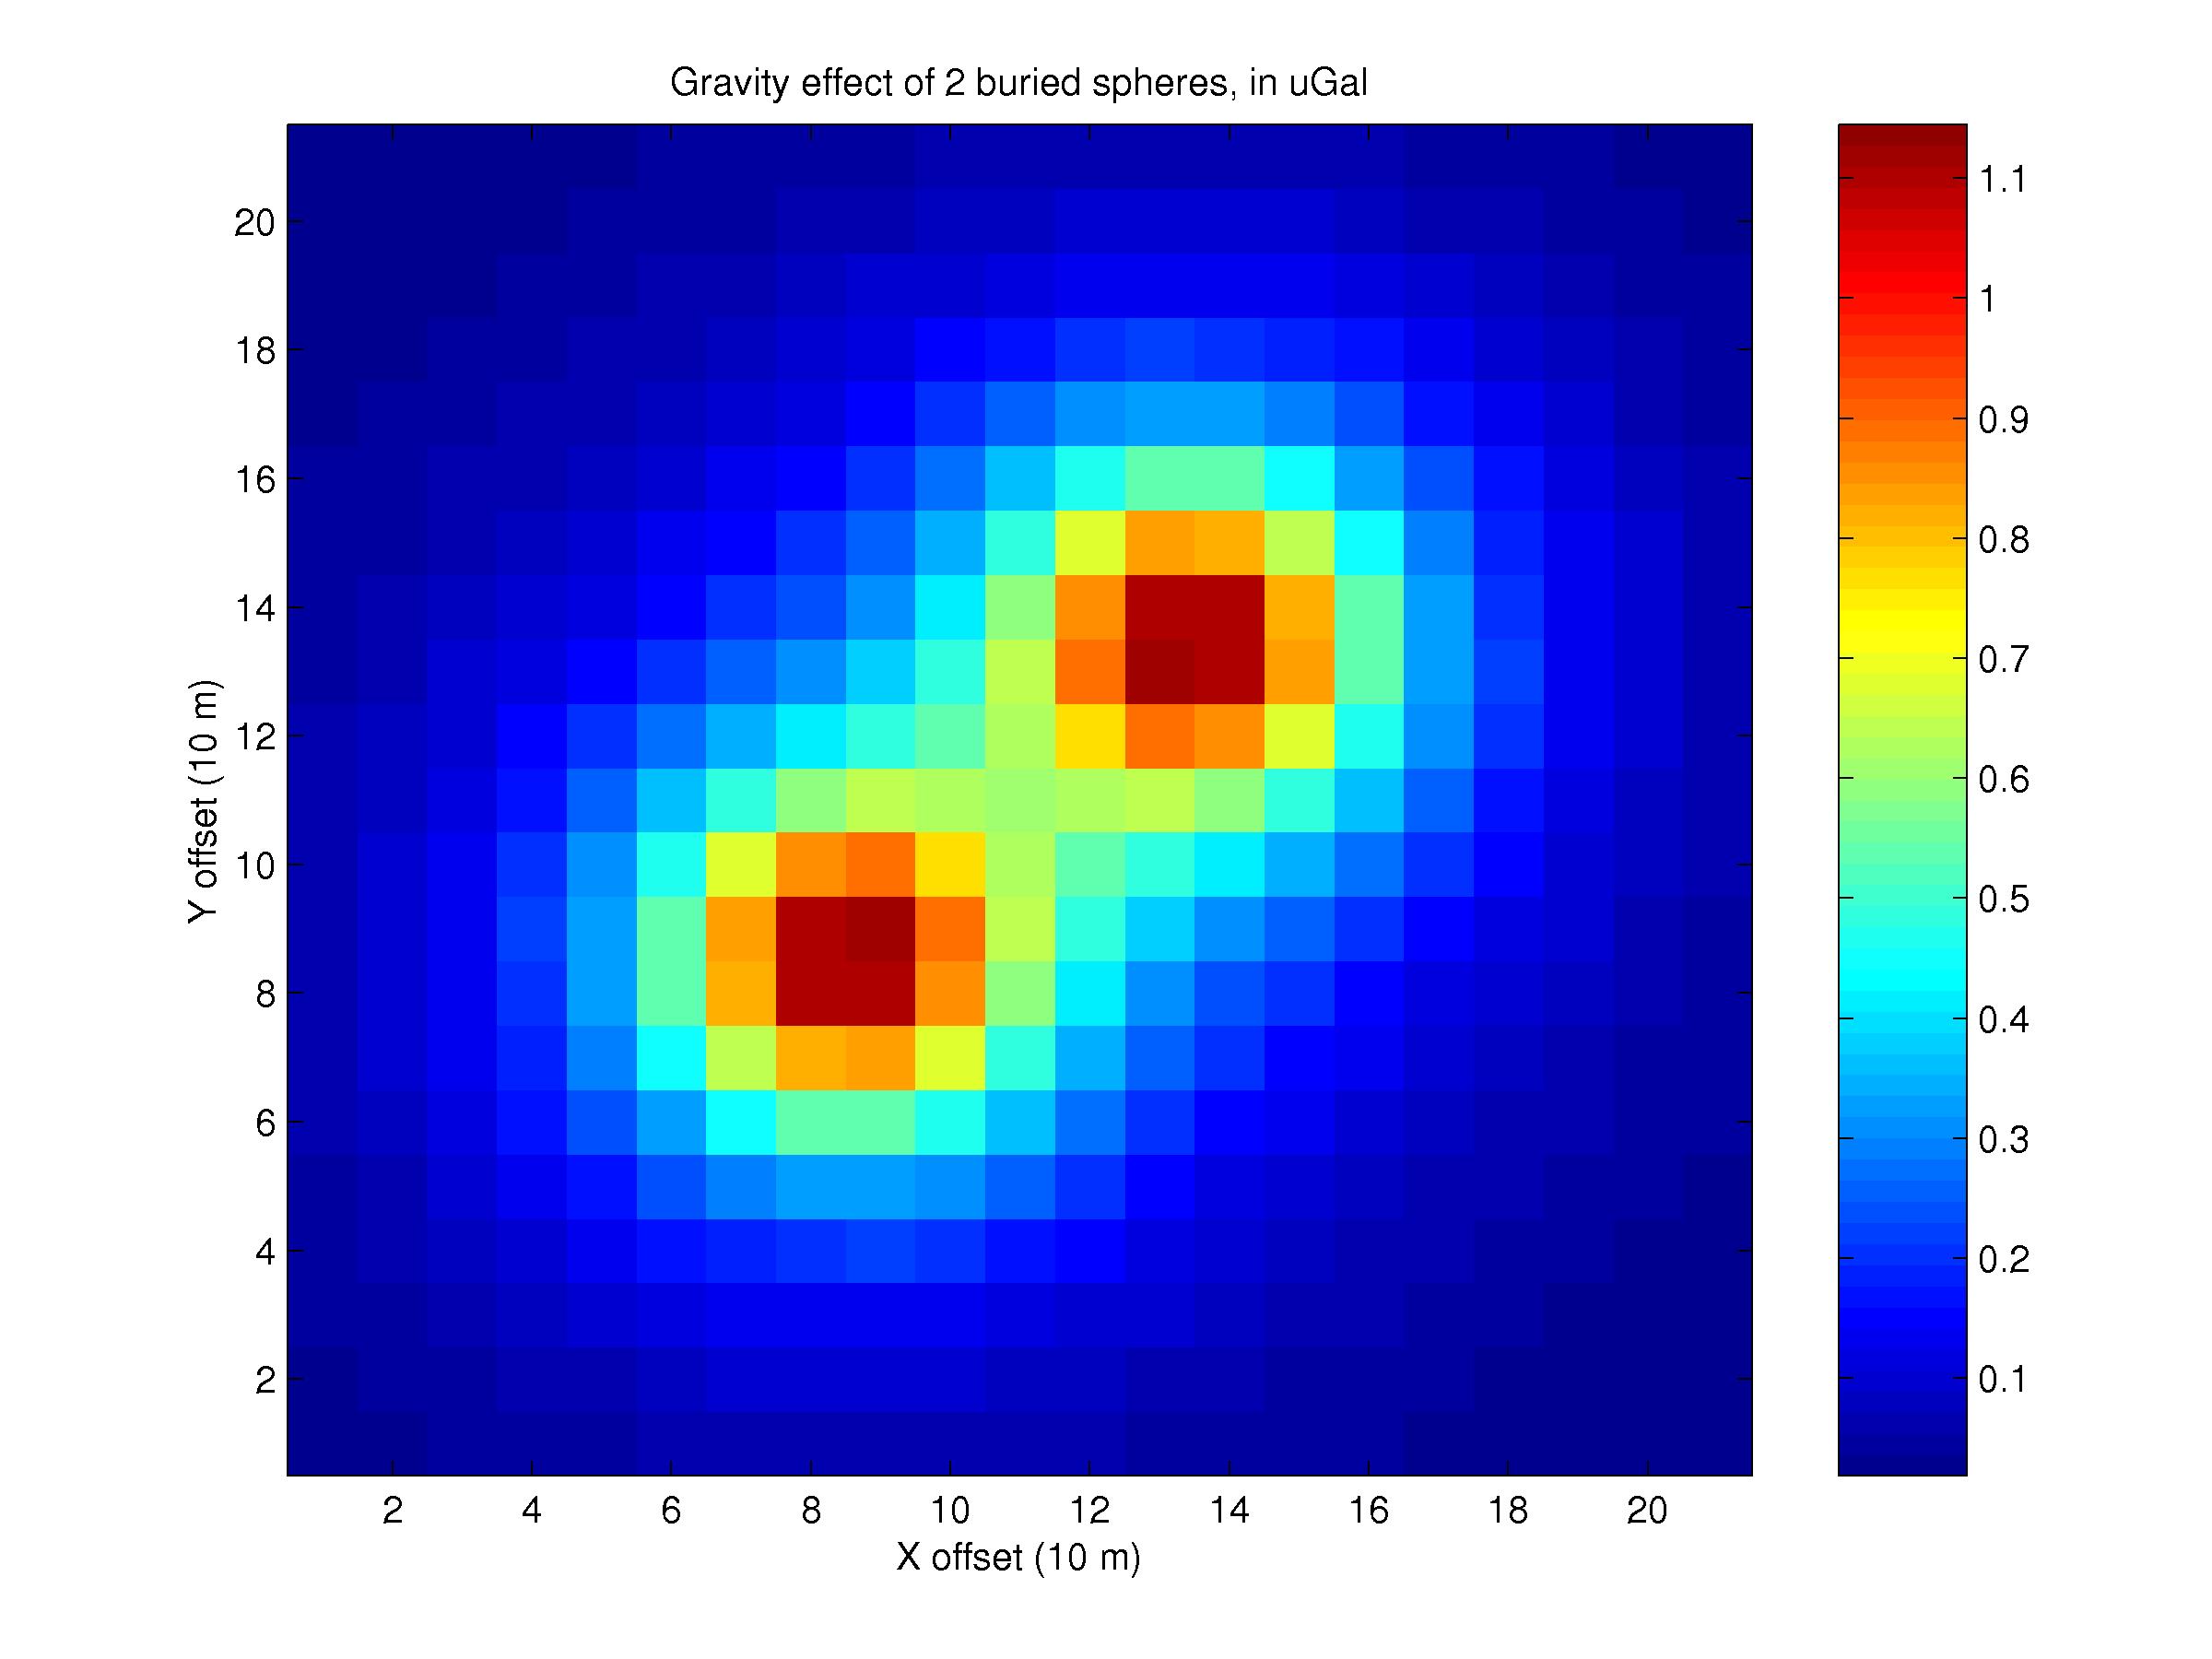
The example model geometry is a set of 2 buried spheres displaced from
the axis. This first image is the computed gravity effect (in uGal).
Gravity is computed on a horizontal grid (at z=0), at 10 m intervals.
The plot was produced by Matlab as a scaled color image.
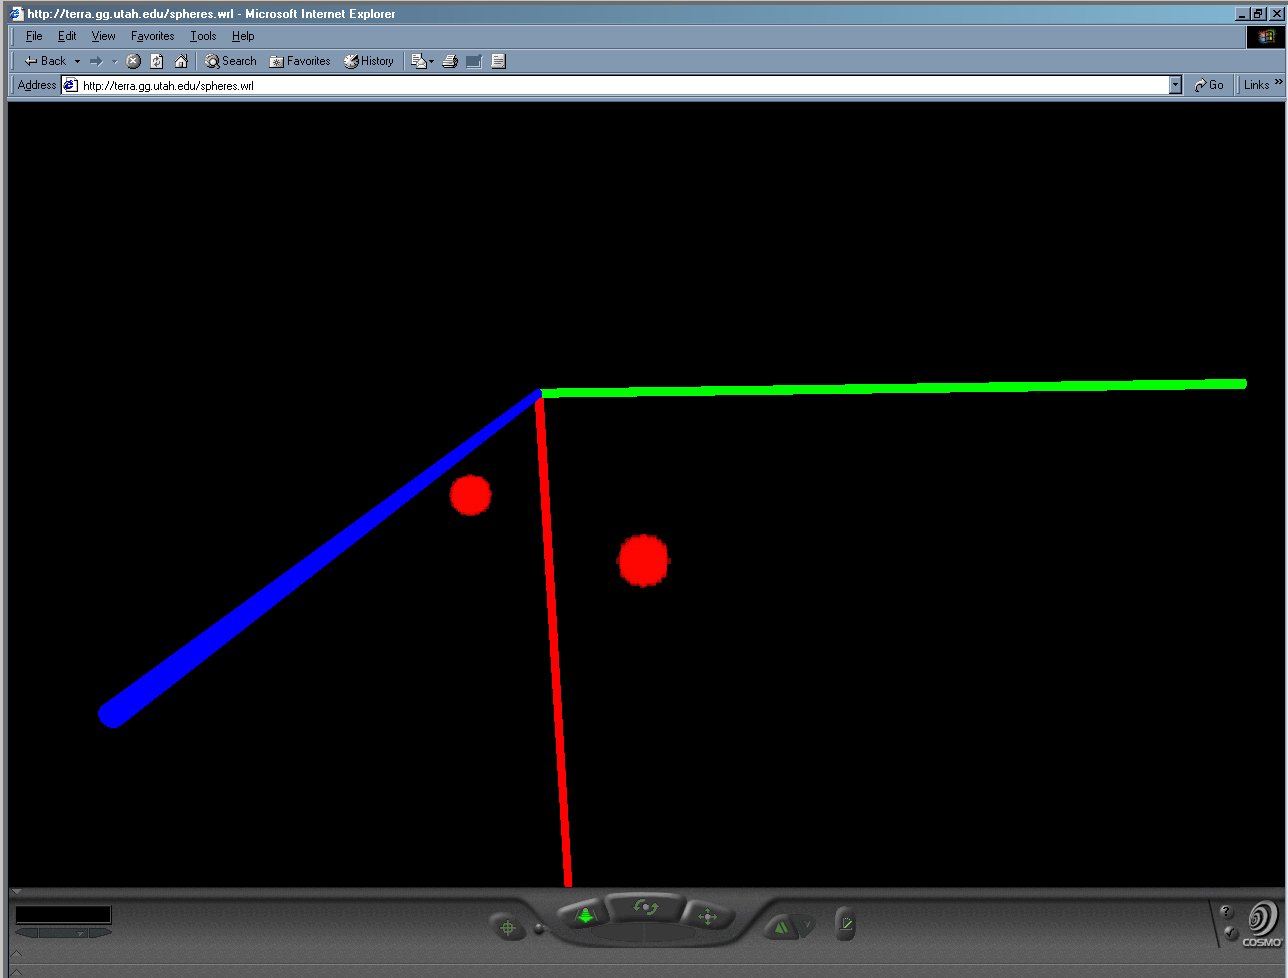
This is the geometry visualized in VRML. Cosmo Player was used for the
rendering, although any VRML2.0/VRML97 viewer should work. This model
has 1030 elements in the 2 spheres. Click on the image for a larger
version. Colored rods are the coordinate axes: red is +z, blue is +x,
green is +y.
Slab and Overlapping Sphere
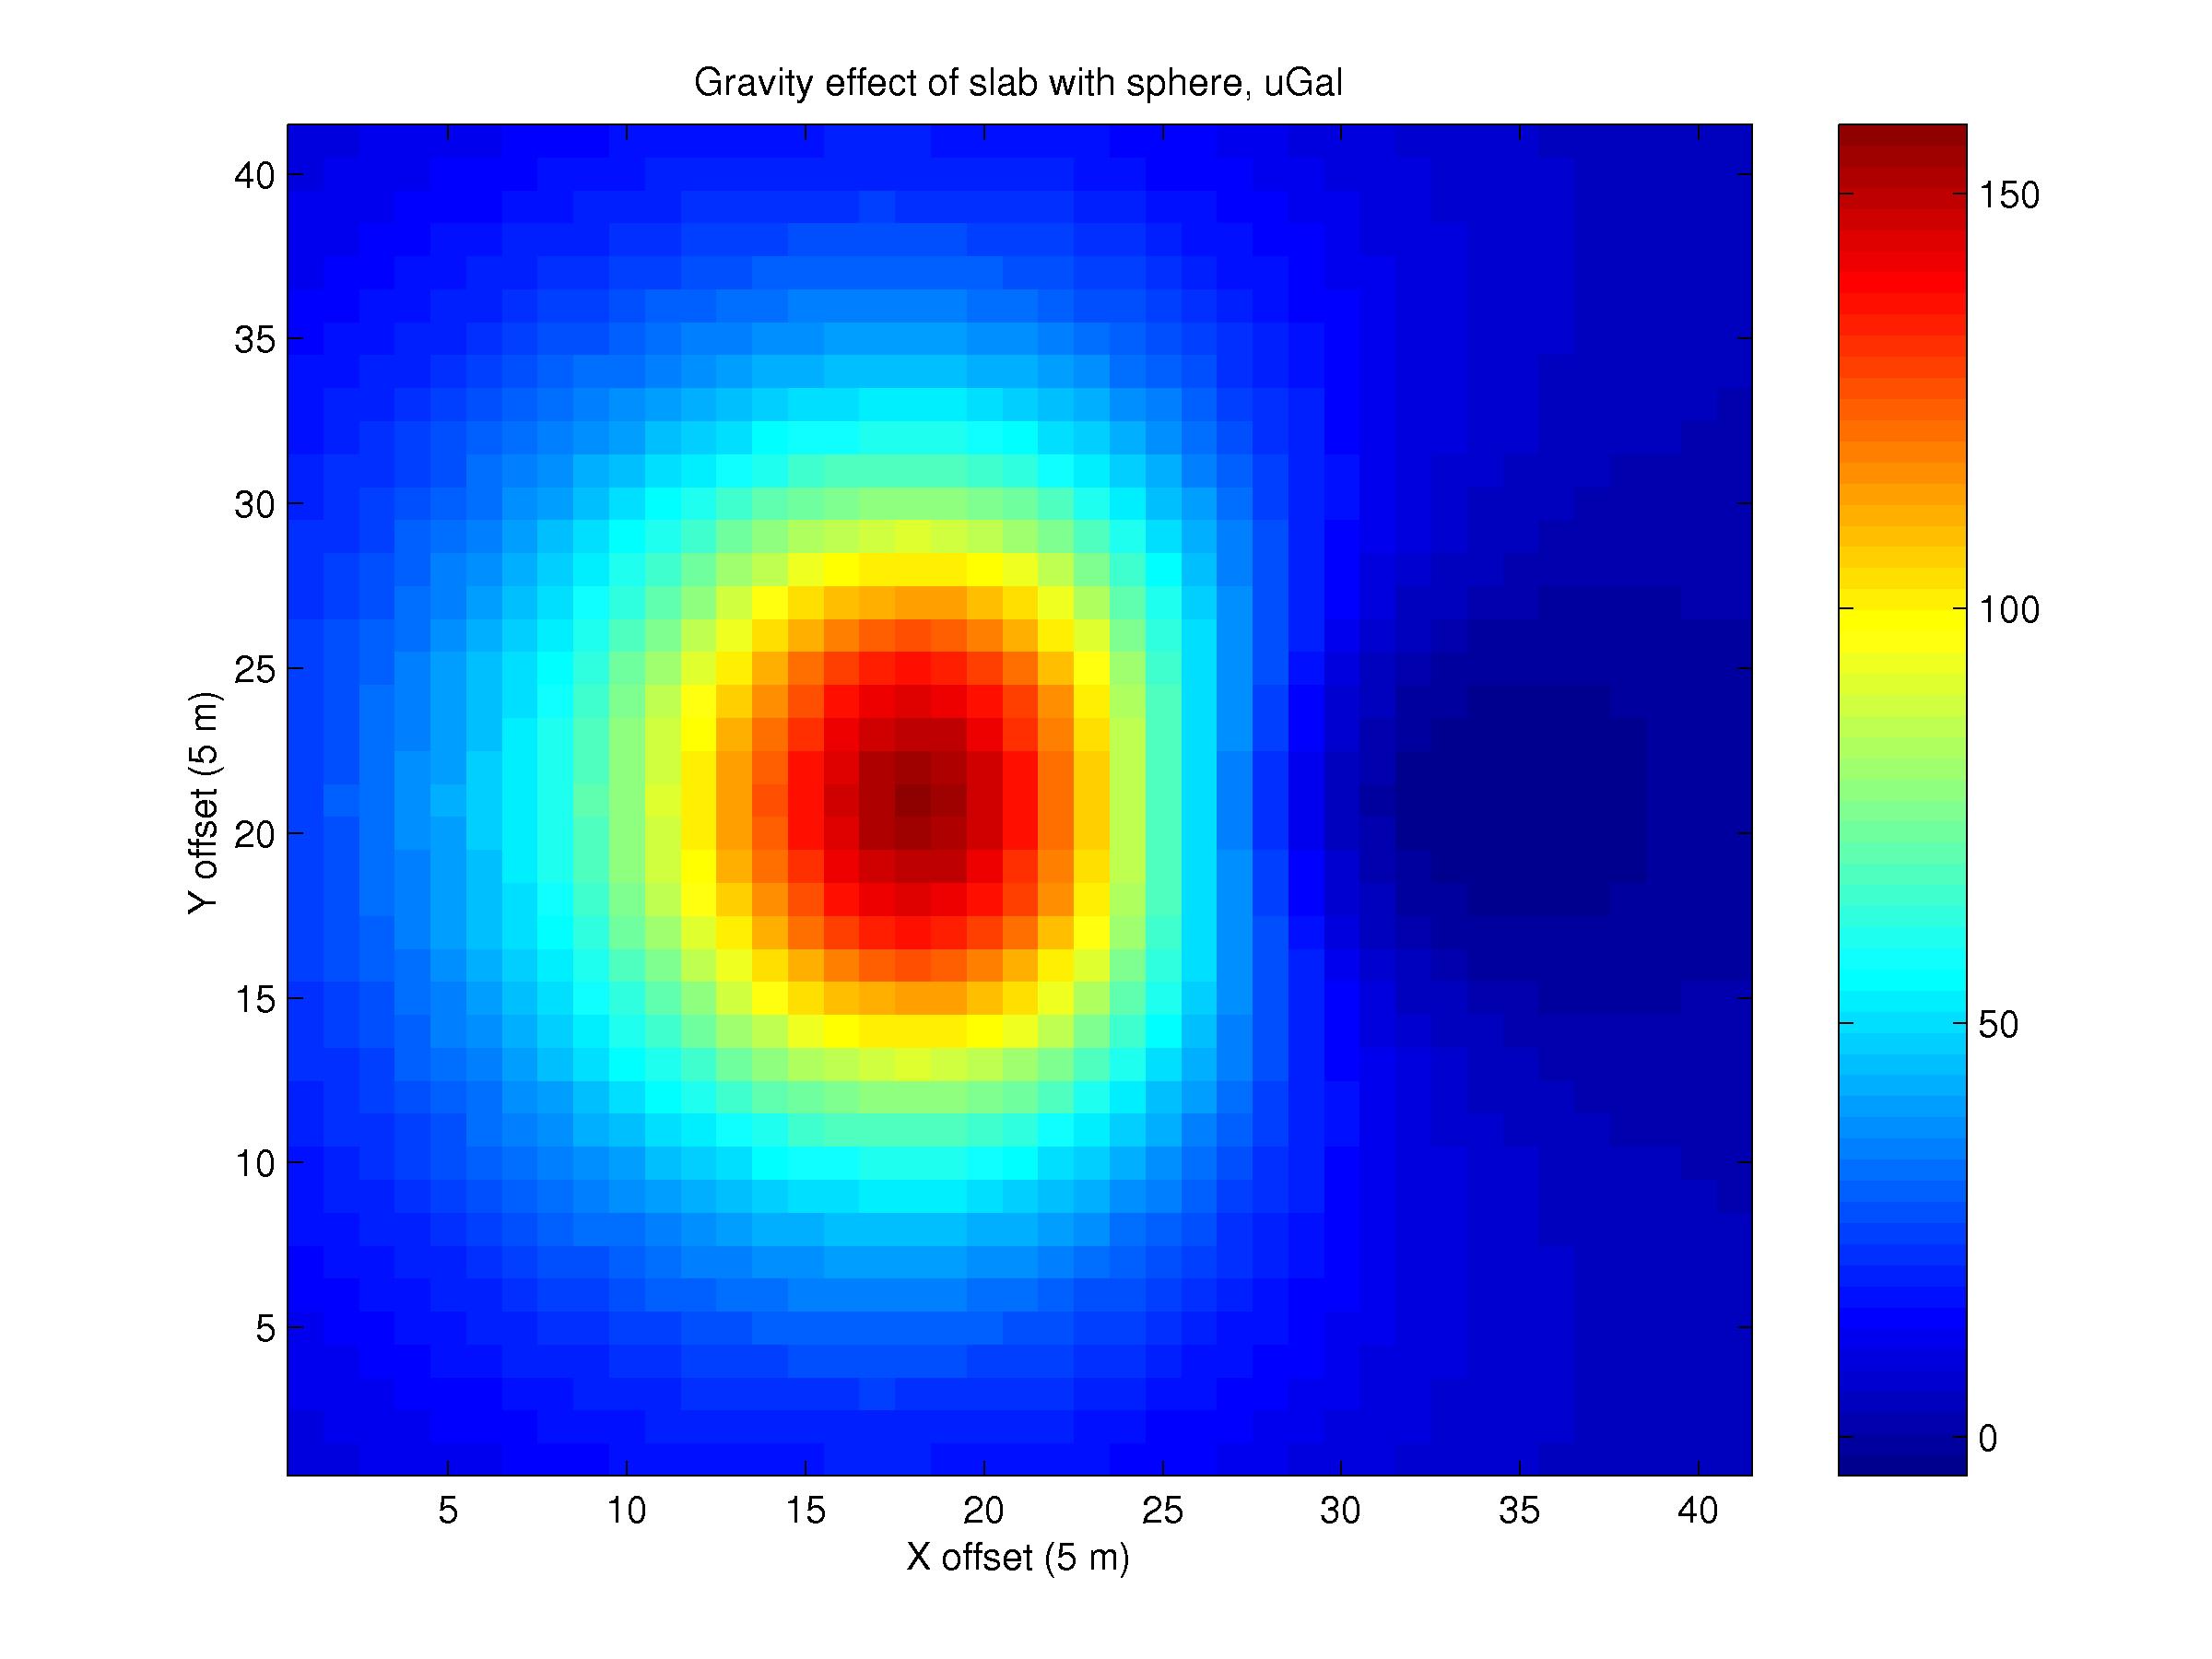
This is the gravity effect of the model. There are 2 bodies; a large slab with anomalous density of 1000 kg/m3, and a sphere with density -1000 kg/m3. The sphere is positioned so that half of it is embedded in the slab. Since the blocks of both bodies are located in the same place, the sphere (which is defined later) takes precedence and replaces the slab blocks. The resulting gravity effect truncates the otherwise symmetric form of the slab. Note that the deep blue depression is actually a negative anomaly, where the sphere overcomes the slab's effects.
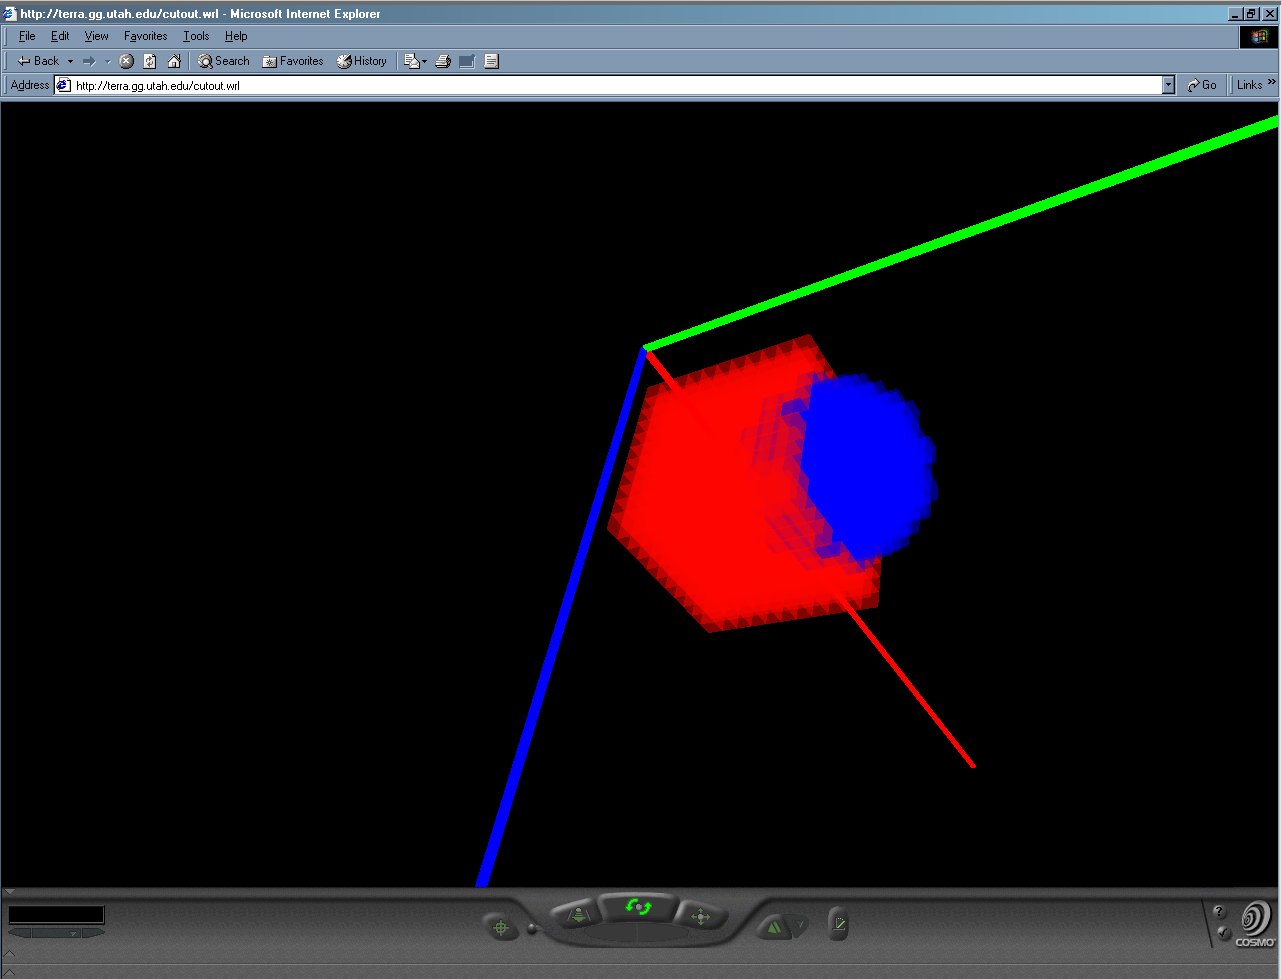
The geometry of the model, visualized in VRML. Again, Cosmo Player is
used for the rendering. Note the transparency of the visualization
allows you to see the sphere elements embedded in the slab. Colored
rods are the coordinate axes: red is +z, blue is +x, green is +y.
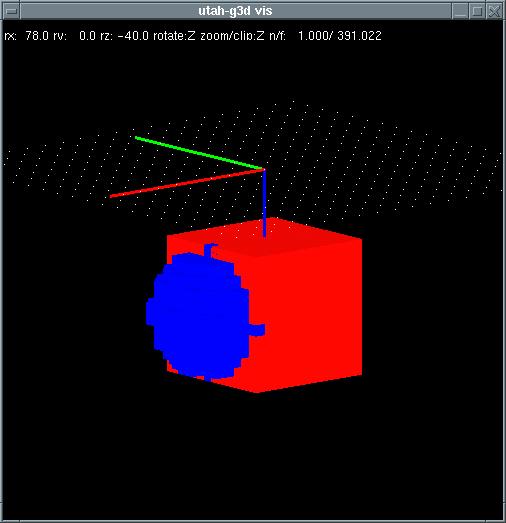
The same geometry as above, rendered with the OpenGL visualization
program of utah-g3d. X-axis is red, Y-acis is green, and Z-axis is
blue. Note the lack of transparency, and the grid of white dots; the
dots are positions for gravity computations using compute.
Interactive viewing (>20 fps) of the 1500+ element model is
easy on the current development machine running purely software
OpenGL. The renderer also runs directly in X Windows, removing the need
for a VRML viewer.