view
Usage
viewdata [filename]
where filename is the name of the raw data file. If the file cannot be
parsed or is not given, an interactive dialog will be used to allow
selecting a file. If no file is selected, the program exits.
Overview
viewdata is a program that plots the information in a raw CG-3M
data file. It does not perform any corrections or manipulations; it is
strictly for looking at the data of the file in graphical form.
Description
The program creates 2 windows: a control panel and a plot window. The
control panel allows for switching the currently viewed
station, saving the current plots to disk, and exiting the program.
The interface is (hopefully) intuitive:
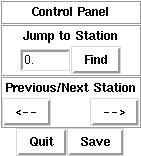
- The Jump to Station box allows the user to immediately
plot a particular station. Type the station ID, as it appears in the
data file, into the entry box and click the Find button. If a
station with a matching ID is found, it is plotted.
- The arrow buttons move to the next and previous stations. The
station order is in a numerically sorted order. If there are stations
with alphanumerics, their order is undefined.
- The Save button writes the current plot window to disk as
a file. The filename is chosen in a file dialog; the default name is
the name of the data file with the station number appended and a
.ps extension.
- The Quit button quits the program; the action must be
confirmed.
The plot window is divided into 4 plot areas:
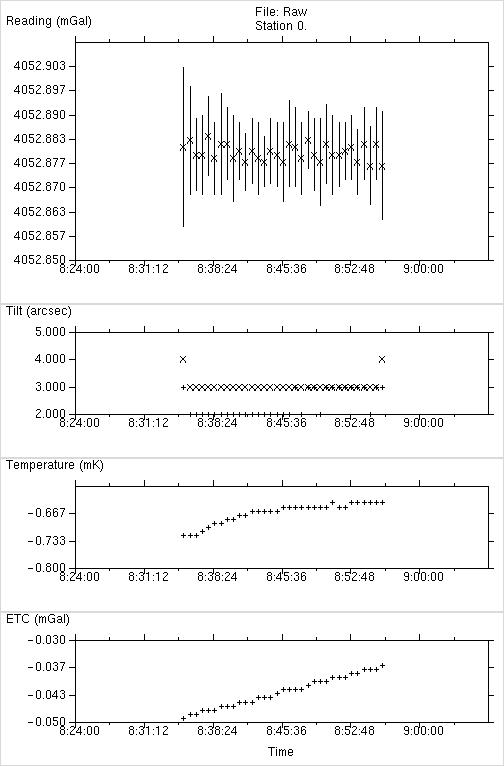
- Gravity - plot of the gravity readings, in mGal; standard deviation
of a reading is indicated by the vertical bar
- Tilt - X and Y tilts, in arcseconds, are plotted: X tilt is denoted
by the "x" symbol; Y tilt is plotted with "+" symbol.
- Temperature - thermistor values, in mK. The temperature is
actually the deviation from the ideal 55 C of the sensor oven.
- ETC - Earth tide correction computed by the meter (Longman, 1959
algorithm), in mGal. This number has already been applied to the
readings in the first panel.
Copyright © 2000, Paul Gettings