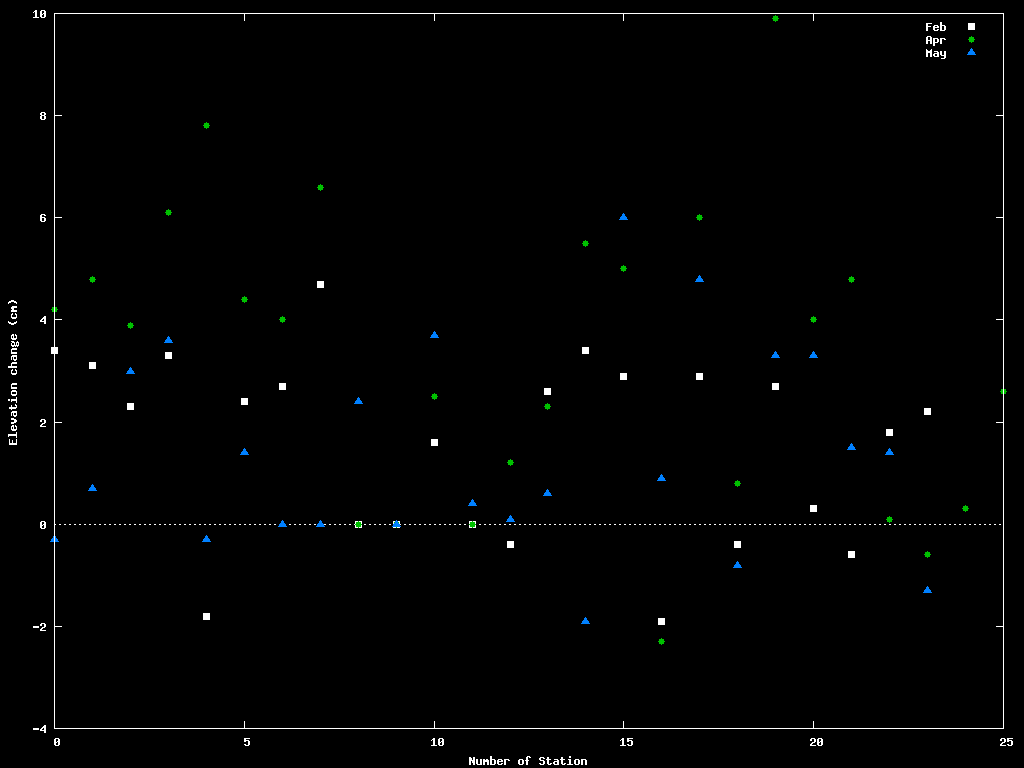
Above is a plot of elevation changes, as a function of station. Squares are for February 2004, circles for the April '04 campaign results, and triangles are May 2004 results. All results are compared to March 2004 campaign results. Number of station is the line number in a results file, and not the number of the WRP station name; mapping from station number on the plot and a map is not easy. This plot is to look at the scatter and overall results. Individual station results are plotted in the contour plots below.
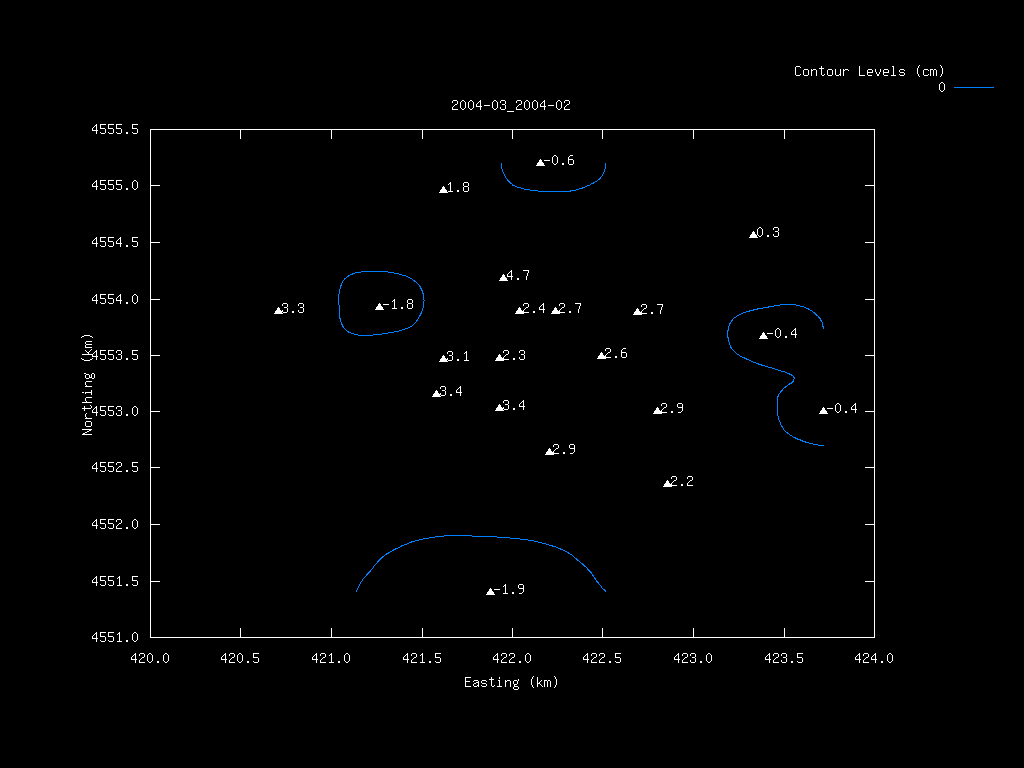
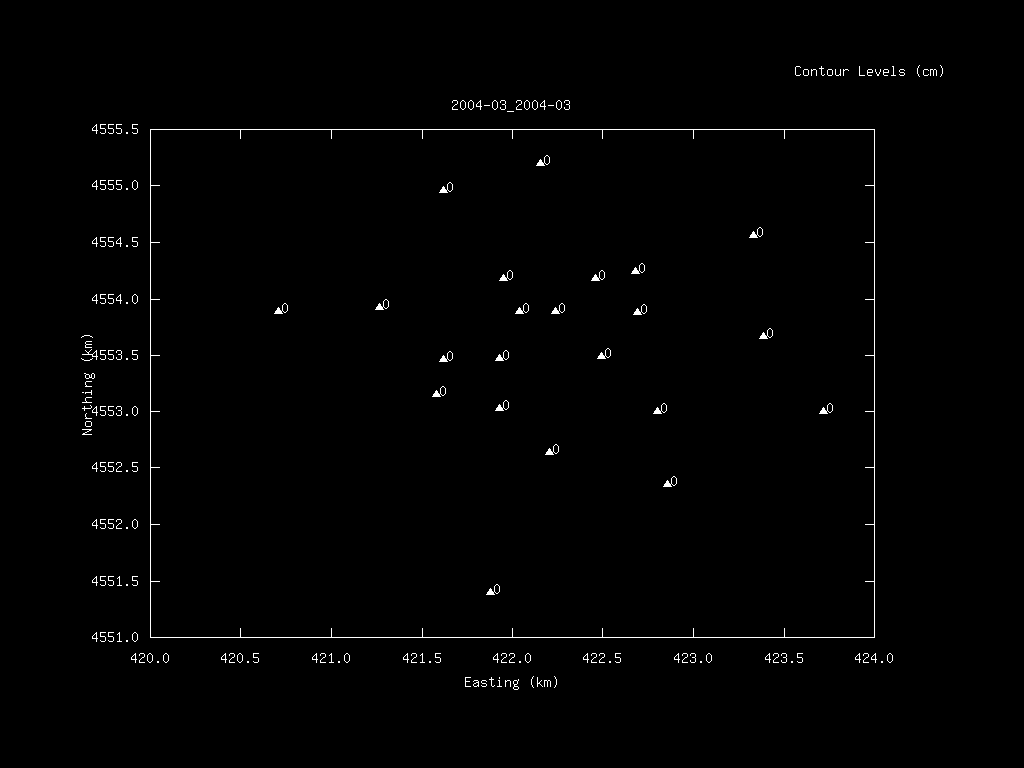
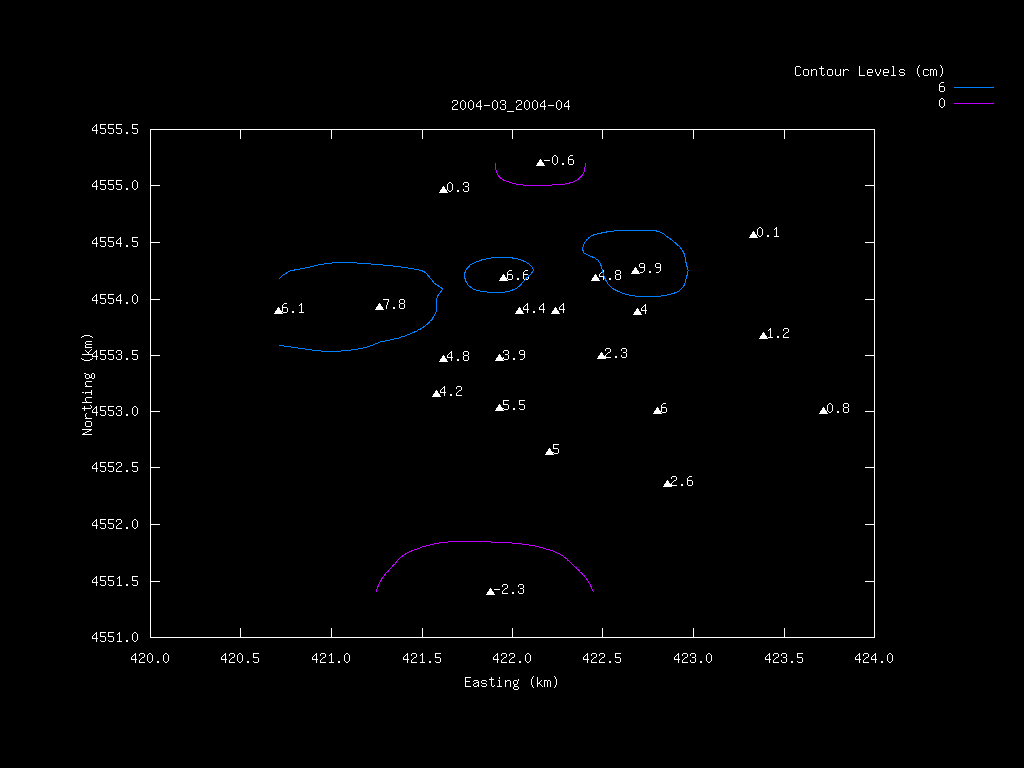
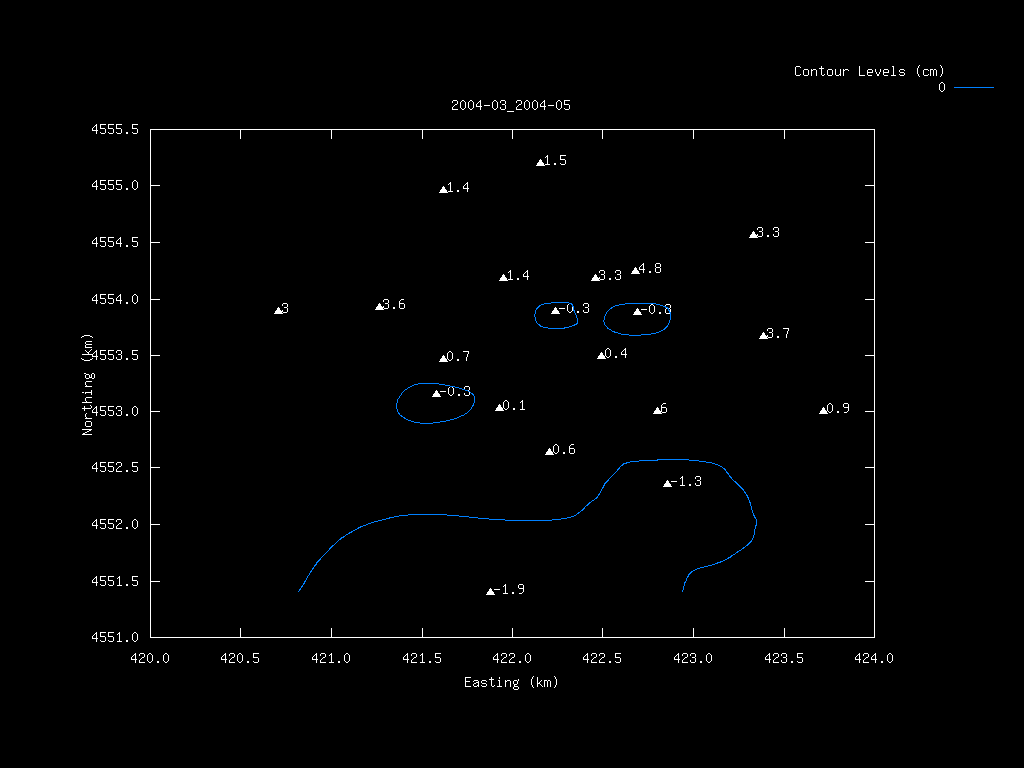
Here are contour plots of elevation changes referenced to an effectively arbitrary zero campaign. Plots are shown as contours of elevation change, in cm. Station locations are marked with triangles, and the numbers are elevation changes, in cm. Note that all campaigns have an assumed vertical error of 2-3 cm. Differences therefore have errors of 4-6 cm. Contour levels are set at -12, -6, 0, 6, and 12 cm for all plots. Axes are UTM zone 12 northing and easting. Plot titles are dates in "year-month_year-month" format. The first date is the reference, and the second campaign is subtracted from the first; negative elevation changes indicate subsidence.