Here is a Postscript timeseries of selected stations with total infiltration volume, and the gravity effect of infinite slabs of pure water of various thicknesses. The slab computations form an easy bound for expected gravity changes, and minimum resolvable water level changes.
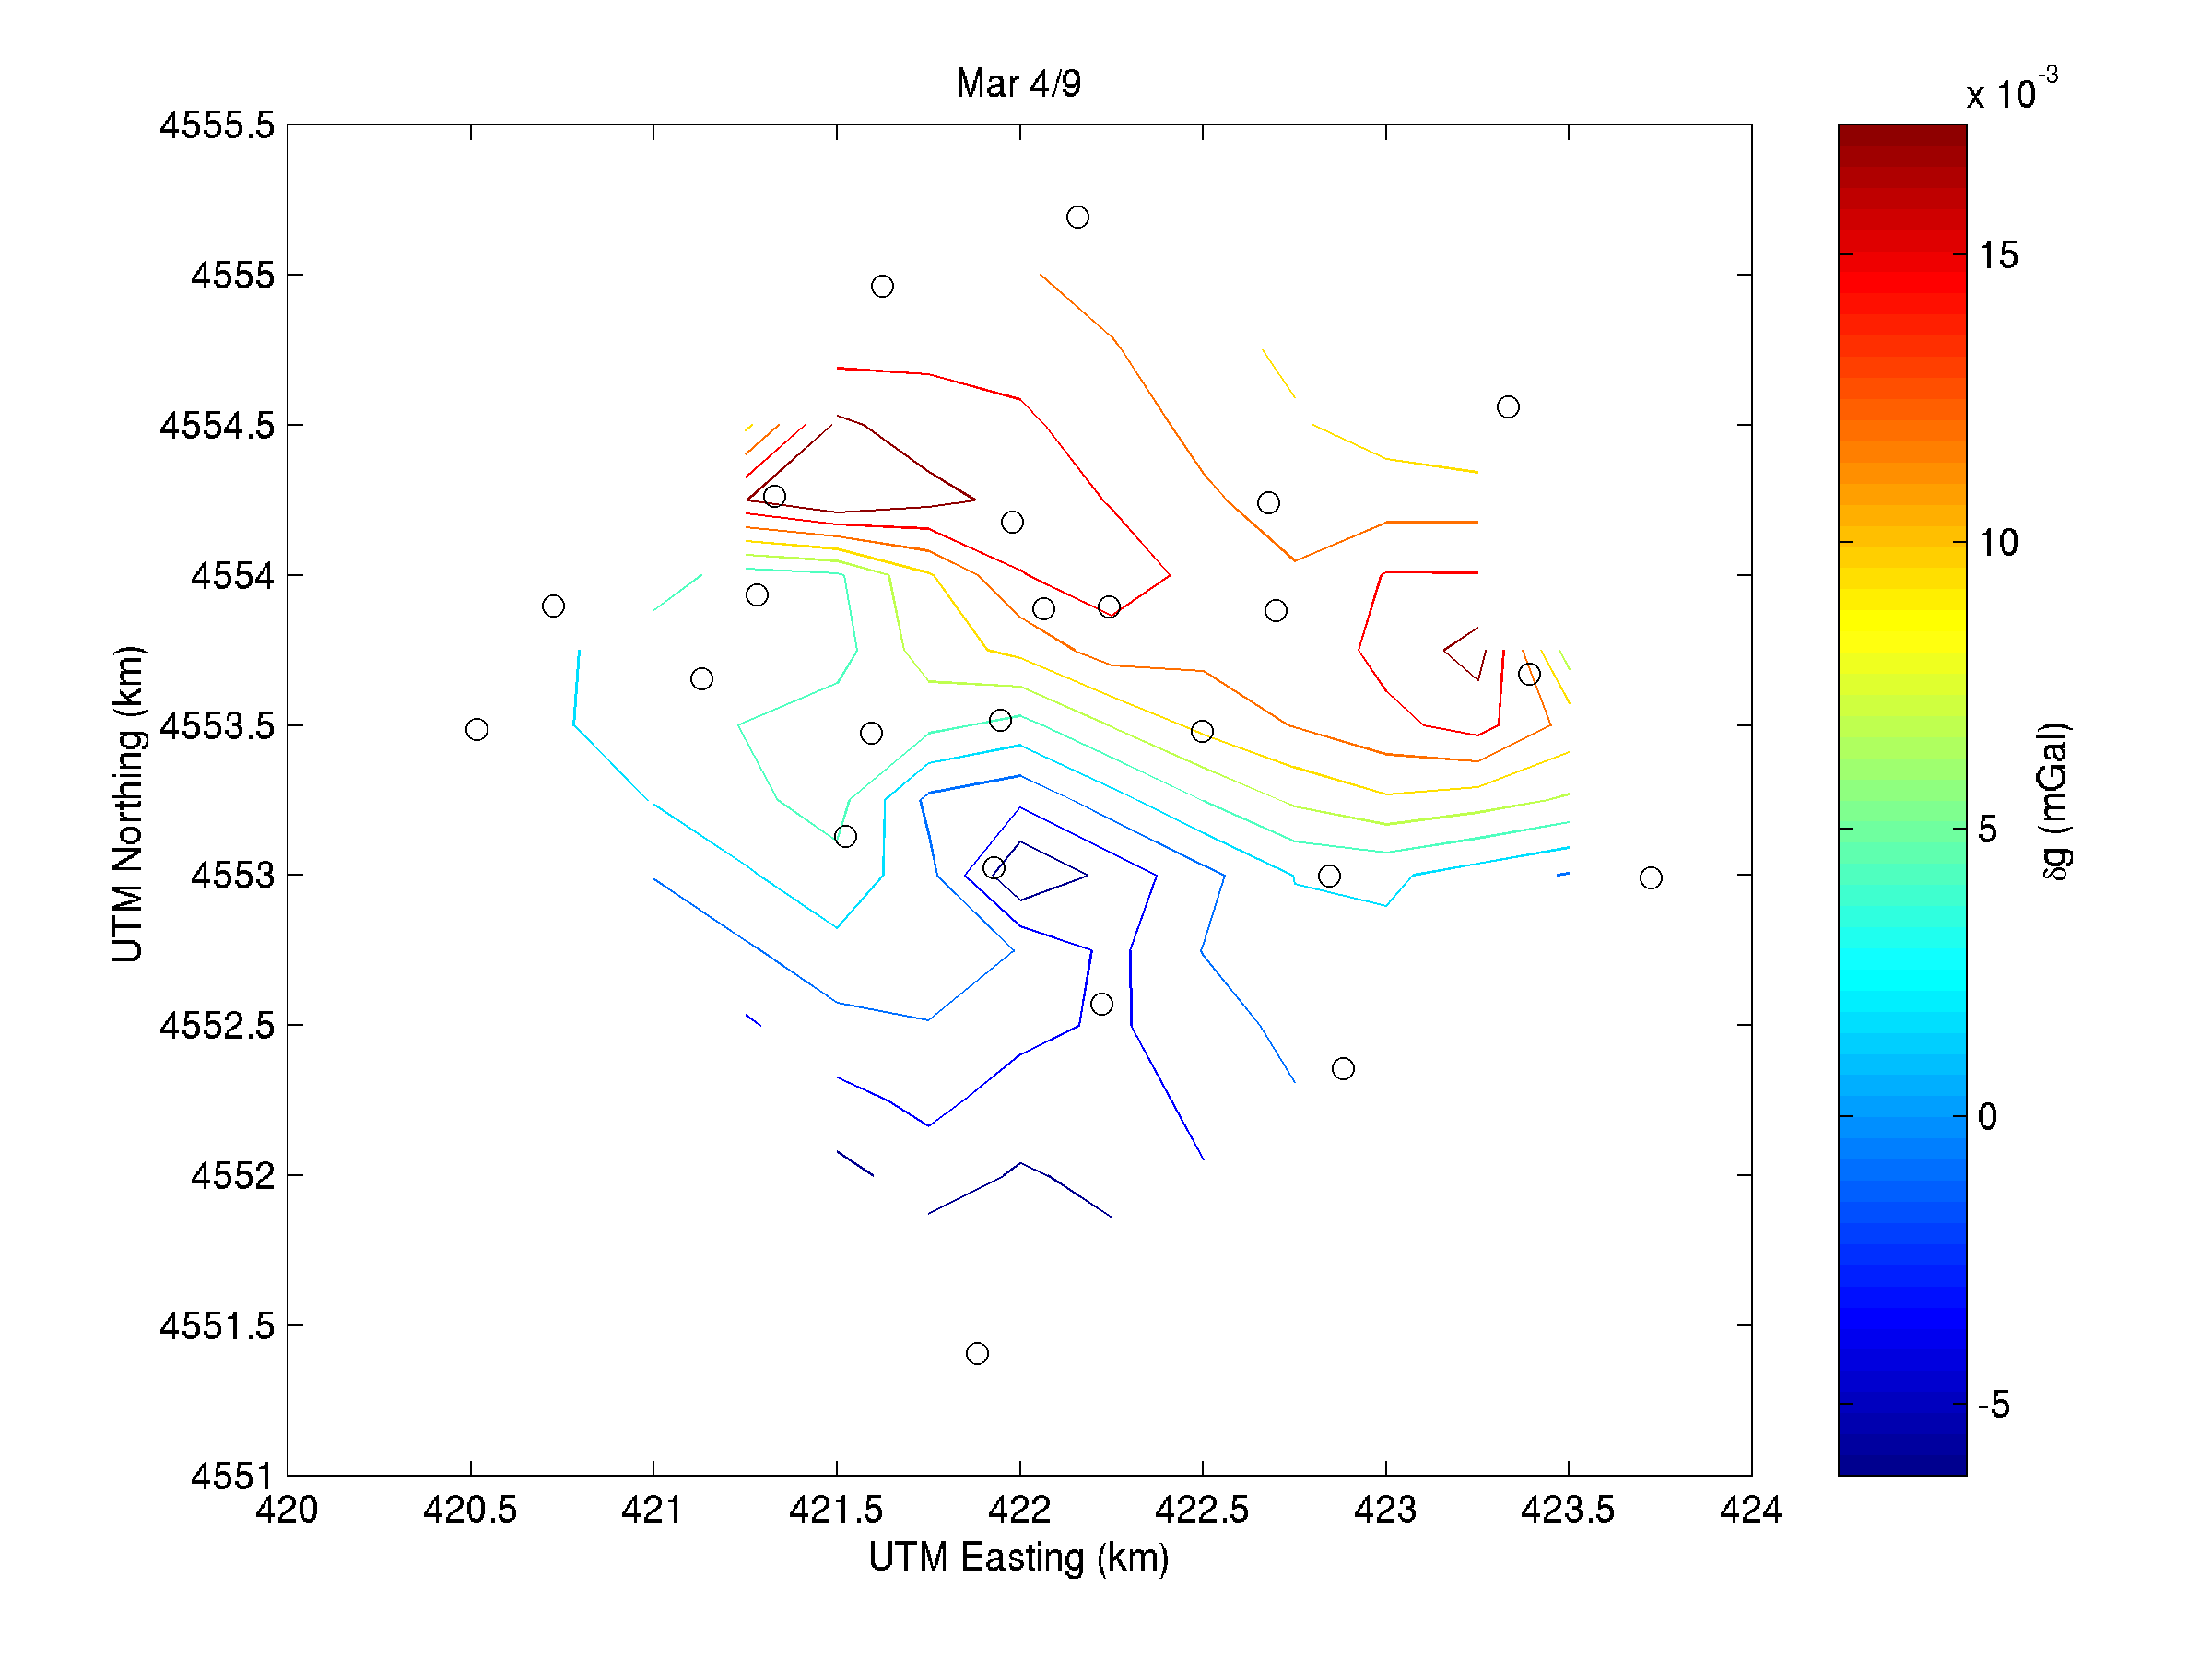
Preliminary results for March 4/9 and 18/19 campaigns, referenced to Feb 21/24 campaign, assuming WKRP stable (click on the image for a 2400x1800 pixel version):
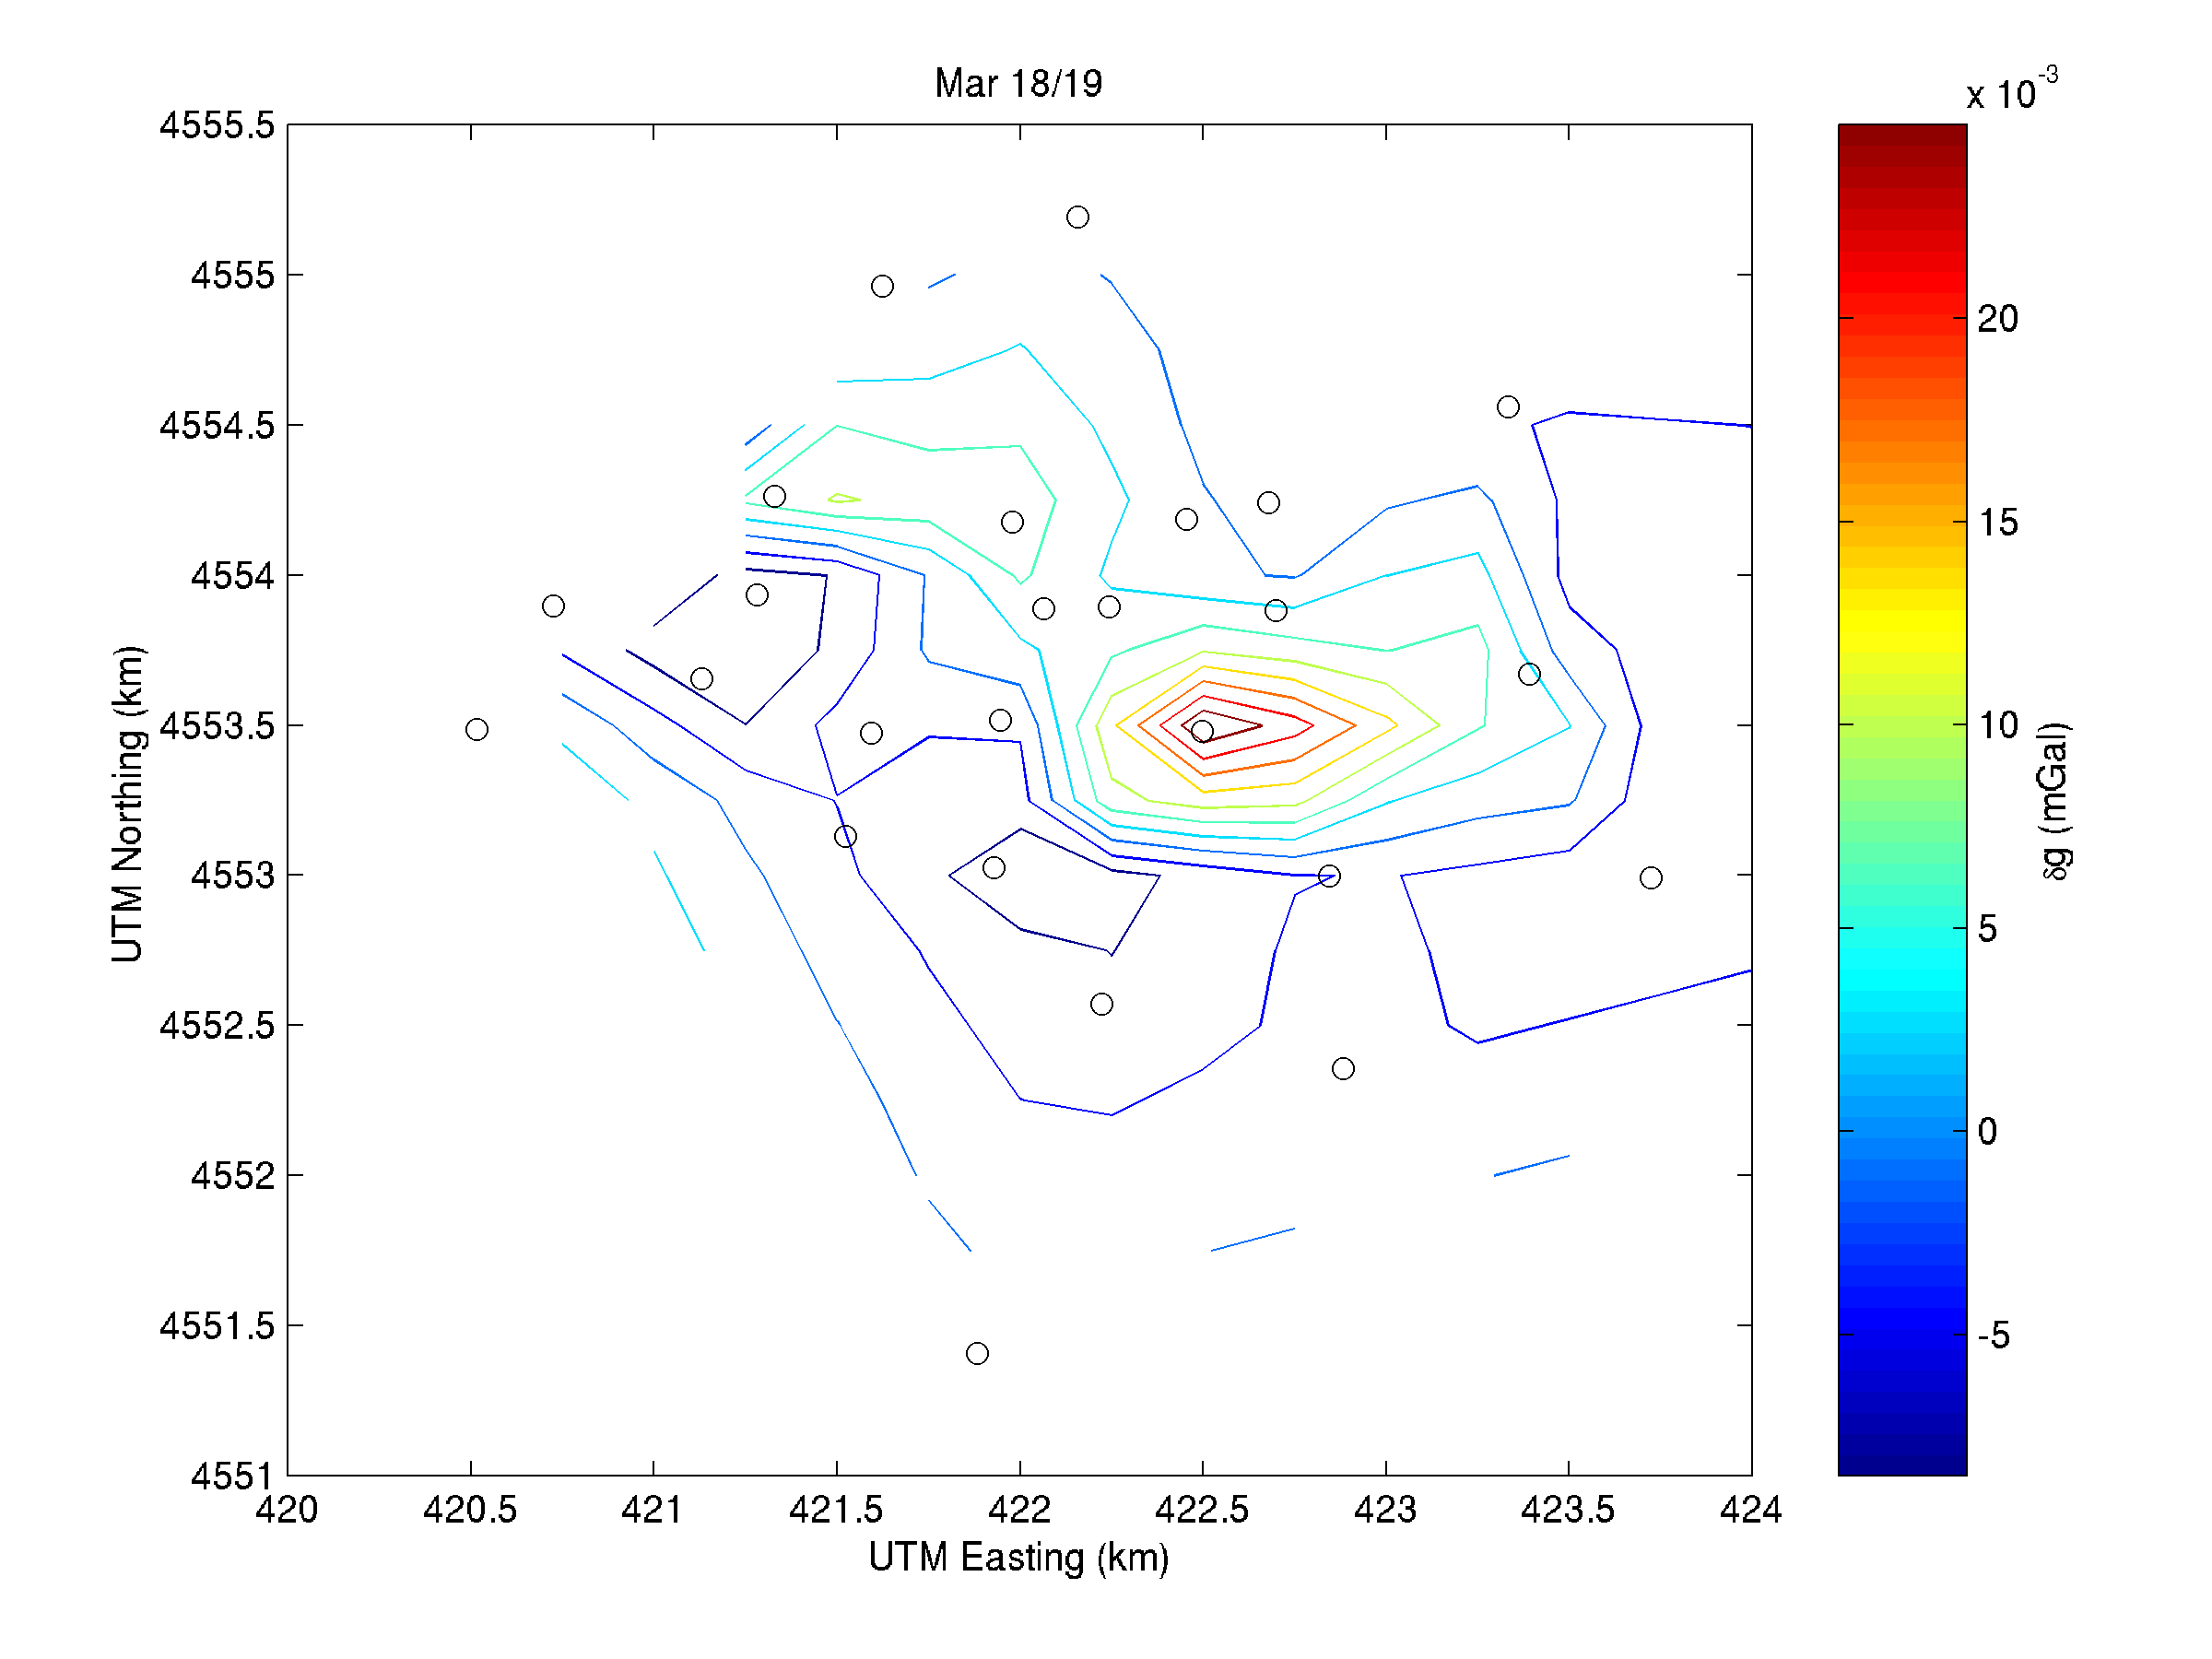
Note that the changes are computed in mGal, but the colorbar scales can be directly read in uGal (ignore the 10-3 at the top). Black circles are station locations; contour lines are generated by Matlab automatically (hence the sharp corners). WKRP is not shown, to expand the scale over the recharge area.
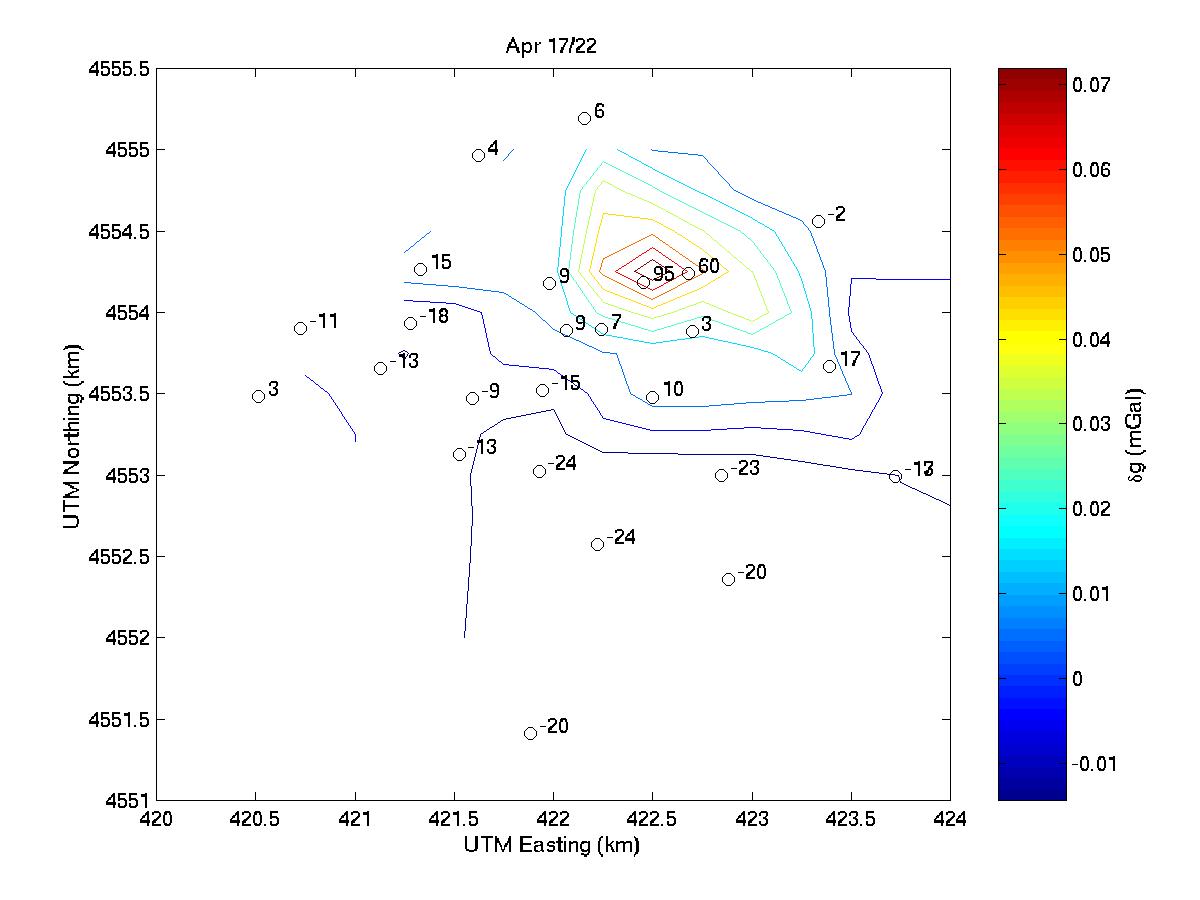
Black circles indicate station locations (WKRP held at 0, not plotted for space), numbers are changes in uGal (10-3 mGal). Contouring performed by Matlab, after gridding using a cubic spline scheme. Colorbar shows contour colors as mGal. Note the 95 uGal rise in gravity at WRP04 (monitoring well casing), and the 60 uGal rise at WRP01 (E edge of infiltration property). Also note the large negative trend in the SW stations (draining groundwater from snowmelt and precip????) becoming more positive towards the infiltration site. This suggests that the near-zero stations just SW of the infiltration site are showing a 20-30 uGal positive signal due to infiltration. All claims subject to revision as more data and processing become available.